Paying Attention to Statistics on Economic Stress

What percentage of American households have income that puts them above the federal poverty line, but still leaves them financially struggling? According to one report drawing on the latest U.S. Census data, it was a hefty 29% of households in 2022. Combined with those in poverty, fully 42% of households were having trouble covering basic expenses.
Throughout the 2024 presidential election, pundits have been wrestling with the question of why voters are so gloomy on the U.S. economy under the Biden administration. It’s been much debated: voters have stayed pissed while metrics like the unemployment rate, job growth, and inflation have all been improving since 2022. Voters handed control of the U.S. House to Republicans in the 2022 midterms, and very nearly the Senate. Maybe the past two decades of increasing financial struggles for working people is at the root of the supposed puzzle!
In May, a Pew poll found that just 23% of U.S. adults said the economy is in good shape, down from 28% in January. The same poll found that respondents’ top three concerns were inflation, political partisanship, and the affordability of healthcare. Other polls from March and May by pollsters Gallup and YouGov have similarly found that inflation and high prices are Americans’ top concerns. As analyst Stephen Semler noted last month, “The rate of inflation is falling, but prices are not — we’re still living with the effects of past inflationary surges.”
One simple explanation of the disconnect is that pundits aren’t incentivized to pay attention to statistics on economic hardship—perhaps because the data is a couple of years behind, perhaps because the numbers are unfamiliar, and perhaps because the financial stress revealed isn’t flattering to Democratic leaders who say they represent working families.
Since mid-2023, the Biden White House has tried to popularize “Bidenomics” after its successful pandemic response—for example, by saying that “Inflation-adjusted income is up 3.5% since the President took office.” But the numbers it cited are slippery—the same data shows that middle 40% of adults age 20+ saw a decline in real income growth during the time period the White House selected. If the same Realtime Inequality data is adjusted to start Q1 2021, when Biden was sworn in, through Q4 2022, the real income growth for the bottom half of adults was only $590. That’s as much as health insurance premiums have gone up each year, so it’s understandable that lower-income earners feel they’re falling behind.
When the Biden campaign touted Bidenomics, it often foregrounded the unemployment rate—known to be a faulty statistic, which according to progressive think tanks would be roughly double if it were capturing the true under-employment rate, i.e. people searching for a job who have given up. A similar critique applies to GDP growth, cheered again this year by the White House, a metric that economist Joseph Stiglitz has panned as a “failure” in measuring well-being. And a few months ago, the Biden White House couldn't resist mentioning the record high stock market—but only 28% of those making less than $50,000 a year own stocks, mutual funds, or have a 401(k) or IRA.
It may surprise many liberals to learn that food insecurity was up 18% under the Biden administration, a finding calculated by Stephen Semler using data from the Census Bureau’s Household Pulse Survey through October 2023. Despite Democrats’ attempts at promoting Bidenomics, the Census data shows an unsettling four in 10 of Americans reported financial hardship in 2023, meaning they found it difficult to pay for basic household expenses in the last seven days.
So why have there been so many think pieces about the sour polling results on the economy? One factor in the confusion might be that surveys of economic well-being aren’t very widely shared online. Some reports on economic conditions are available from groups like EPI, CBPP, CAP, the Roosevelt Institute, Dēmos, and other poverty researchers. But they are not easy to cite as authoritative dashboards, and not widespread on TikTok, Instagram, and YouTube. (One more timely exception is the Atlanta Fed’s Wage Growth Tracker, last updated in April 2024, which uses data from the Census’ Current Population Survey.)
The Democrats’ 2016 Electoral College loss was a grievous surprise, but could have been foreseen with closer attention to the economic situation of two key national voting groups. The first is so-called swing voters (including new or undecided voters) in battleground states, who tend to be younger, more diverse, and politically disengaged, according to a Data for Progress report from May. The second is infrequent voters, or sporadic voters, in closely-fought states like Arizona, Georgia, and Wisconsin. And in an arcane voting system like the one the U.S. has, these are the voters that need to be fully zoomed-in-on ahead of a presidential election. It’s not clear to me, working in political journalism, that think tanks are delivering briefings on poverty rates in places like Nogales, Arizona and Vidalia, Georgia to the inboxes of mainstream political reporters and their editors that drive the national discourse. It takes a fair amount of clicking to focus the available charts on their real-world economic status.
Overall, Biden statements talking about the unemployment rate risks leaving out these key voters, like those in my home city of Milwaukee, Wisconsin, who will decide the presidential election. The data shows that working people like those in Milwaukee’s lowest-income neighborhoods have been struggling under Obama and Biden as well as Trump, and there’s little relief coming from Congress—the Senate is choked by the filibuster rule, last changed in 1975.
Meet ALICE
One little-discussed dashboard called ALICE—which stands for Asset Limited, Income Constrained, Employed—was started by the United Way of Northern New Jersey to track economic well-being. Americans in the ALICE group have income above the federal poverty level (FPL) but below the cost of basics, which include housing, child care, food, transportation, health care, and technology. From 2007-2022, the story it tells is a ratcheting-up of financial pressure on lower-income households—the perpetual American stress of being one car accident or ER visit away from ruining debt.
First, the current situation. Of 129 million households, 29% were ALICE as of 2022 and 13% earned below the FPL, according to its latest data from the American Community Survey (2022), the Household Pulse Survey (2023), and the Federal Reserve Board’s Survey of Household Economics and Decisionmaking (SHED) (2022). The number of ALICE households and households in poverty both increased from 2021, meaning 54 million households were below the ALICE threshold. In Franklin County, Ohio, where costs and wages are near the median for all U.S. counties, a survival budget for a family of four increased from 2021 to 2022 by $6,000, reaching $96,480, the report found.
For commentators confused about why polls are so tight, here’s more data to review. A couple of 2024 presidential battleground states had higher-than-average ALICE rates in 2022, according to the national map: Georgia was 35% and Nevada was 31%, while Arizona was right at the 29% average and Pennsylvania was close at 28%. A set of 28 states, including Georgia, Michigan, Pennsylvania, and Wisconsin, have their own ALICE reports with more information.
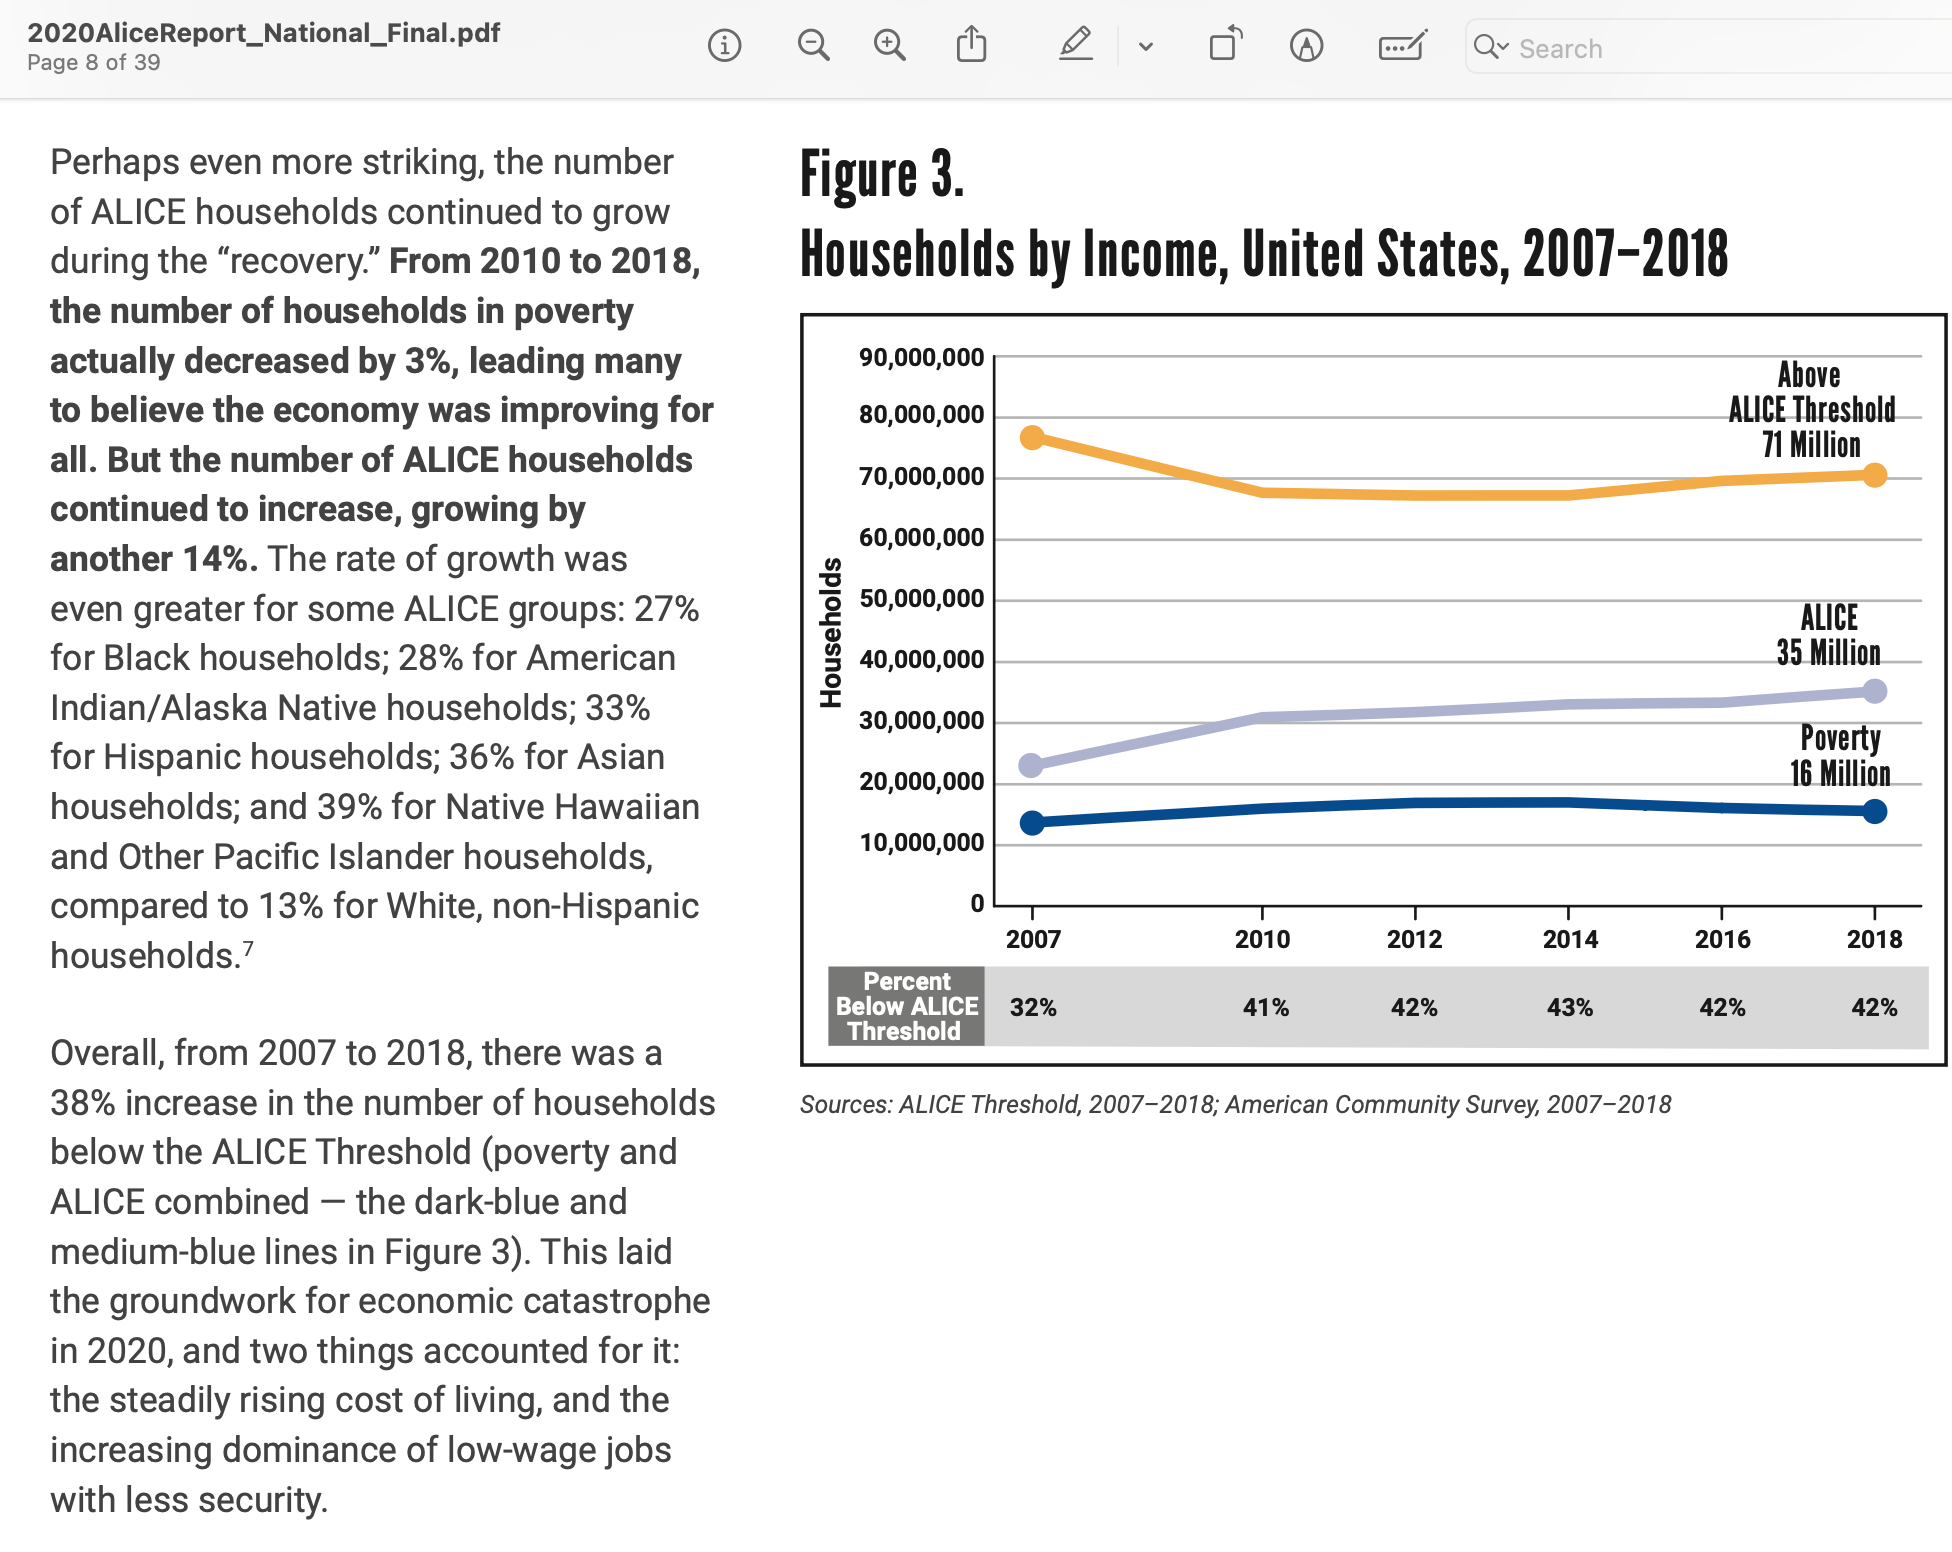
The trend in ALICE households can be found in the 2020 report, which has data for 2018: Overall, from 2007 to 2018, there was a 38% increase in the number of households below the ALICE Threshold (poverty and ALICE combined). This laid the groundwork for economic catastrophe in 2020, and two things accounted for it: the steadily rising cost of living, and the increasing dominance of low-wage jobs with less security. Or, looking at the period from 2010-2018, with Obama (mostly) in the White House and Republicans (mostly) in control of one or both chambers of Congress, the number of ALICE households grew by 14%, and stood in 2018 at 27% ALICE. It's ticked up since then.
No wonder the ostensibly fiscally conservative Tea Party that took control of the U.S. House in the 2010 election, and the Senate in 2014, found a welcome reception as it played to resentful voters.
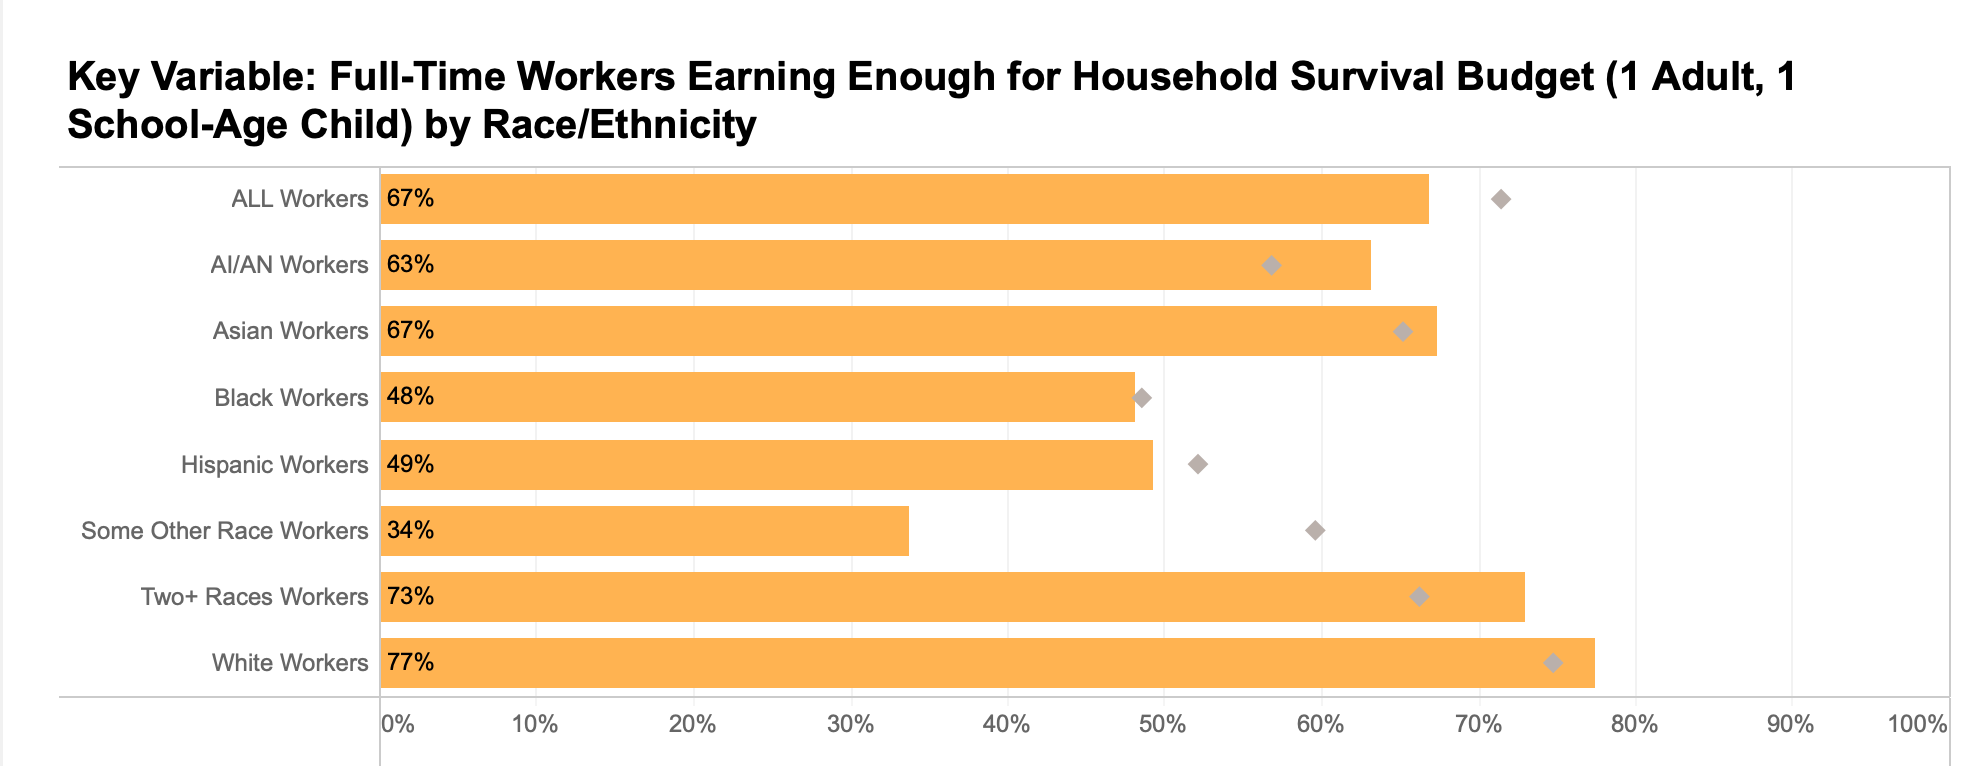
A more granular picture of economically-disgruntled voters can be found on the interactive ALICE dashboard, which currently uses 2021 data from the U.S. Census Bureau’s Public Use Microdata Sample (PUMS). In Milwaukee County, just two-thirds of full-time workers were earning enough for a household survival budget the year that Biden took office. Among Black workers in Milwaukee County, only 48% were making enough, and only 49% of Hispanic workers. Over half of ALICE workers in the county were age 25-44.
Scanning a few other urban areas on the dashboard: in Allegheny County, Pennsylvania, just 49% of Black workers were making enough in 2021; in Cuyahoga County, Ohio, just 50% of Black workers. In Clark County, Nevada, only 39% of Black workers and 41% of Hispanic workers were making enough that year, and only 56% of all workers.
We’re careening toward a consequential election, but the last PUMS dataset was for 2022, meaning we don’t know as much as we could about ALICE voters before November 2024. In the here and now, political leaders could do more to listen to the deep concerns of Black voters in Milwaukee, who say they are pressed by the high cost of housing; in 2021, Democrats in Congress missed their chance to enact a historic investment in affordable housing. Even Democratic National Committee members appointed by their state parties say they have a tough time having real dialogue with DNC officials—or even sharing information among themselves.
A newer project called the CORE Score from the American Academy of Arts & Sciences' Commission on Reimagining Our Economy launched in November 2023, with another measure of well-being. Its latest data for its Wellbeing metric is for 2021; a methodology document details its data sources.
Some studies have found that corporate consolidation and monopolistic pricing quietly played a large role in voters’ irritation, over the past couple years, with stubbornly high costs. A January report from the Groundwork Collaborative found corporate price gouging causing inflation: While labor and nonlabor input costs have played a role in price increases, corporate profits drove 53 percent of inflation during the second and third quarters of 2023 and more than one-third since the start of the pandemic. Comparatively, over the 40 years prior to the pandemic, they drove just 11 percent of price growth.
There’s little discussion of this slightly newer document online, but a Federal Reserve Board report for 2023 found: Most adults said that changes in prices they paid compared with the prior year had made their finances worse, and a majority adjusted their spending in response to higher prices. Low-income adults were more likely to experience difficulties covering expenses. These difficulties included not paying all bills in full, sometimes or often not having enough to eat, and skipping medical care because of cost. The publication uses data from the Board's 11th annual Survey of Household Economics and Decisionmaking (SHED), fielded in October 2023.
During the first year of the Biden administration, the coalition of Democrats in Congress—from progressives to rank-and-file to centrists—had agreed on a legislative plan to get the Build Back Better Act passed in the Senate. The sweeping budget plan would have invested in paid family and medical leave, child care programs, universal pre-K, a child tax credit, and much more. But after months of legislative delay, President Biden was eager for a win on the bipartisan infrastructure bill favored by corporate lobbyists and centrists, and at his request, House Democrats abandoned their strategy and voted on the infrastructure bill first. As predicted, the Democrats lost their leverage over the Build Back Better Act in the Senate, and the social spending plan expired after further months of angst. Chalk up another popular set of social programs that could have delivered for the skeptical, financially-pressured voters of Milwaukee, only to die in the U.S. Senate.
Until the Democratic Senate caucus is forced to reform the filibuster, it will remain tough to pass measures that could address financial pressure like the Raise the Wage Act, the PRO Act, the Stop Wall Street Looting Act, a public healthcare insurance option, Medicare for All, and more. (On the other hand, potential reductions in annual must-pass defense spending are perennially available to lawmakers.) A political party that actively listens to and responds to the four-in-ten struggling households would be a good first step.